
Make every mile
accountable.


One source of truth the whole operation trusts.
Five modules score every part of your operation and feed the same coaching engine — so the technician logging a defect and the safety director reading CSA work from the same live numbers.
- Drivers see their own scores and coaching in-cab
- Managers coach by category with the evidence attached
- Leadership tracks cost and risk across the whole fleet
From raw telematics to coached behaviour — in four moves.
Connect
Link Geotab, Lytx and your ELD. No new hardware, no rip-and-replace.
Score
Every vehicle and driver gets utilization, efficiency, compliance and safety scores.
Coach
Surface the costliest behaviour and coach it — by category, with the evidence attached.
Save
Watch the leak shrink. Track captured savings and cost in one command center.
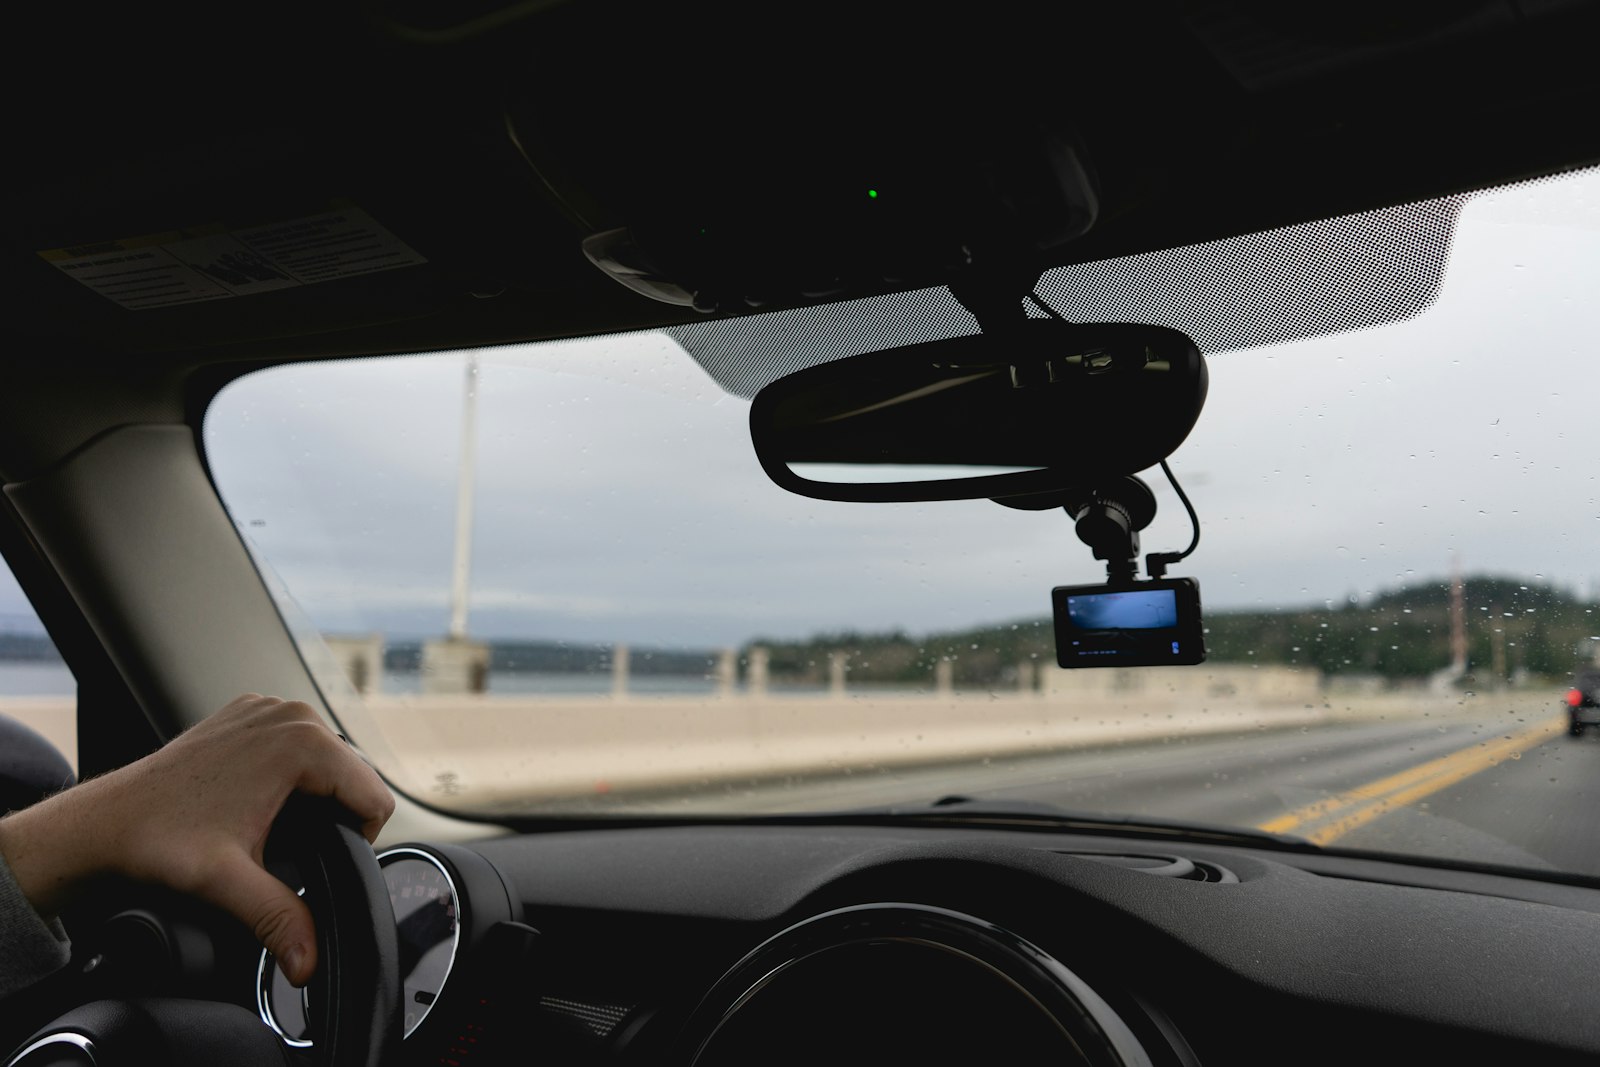
Know the problem.
See the proof. Fix it.
Every driver scored across safety, efficiency, compliance and utilization — with the evidence behind every number and one-tap coaching to close the loop.
Turn driver behaviour into a dollar figure.
Driver-centric efficiency and cost. See what each driver gained you with smart cruising — and what they cost you in fuel waste and idling — down to the dollar, per driver.
- Miles driven, idle hours and fuel use per driver
- Cruise gains vs fuel-waste losses, in dollars
- Coach the events driving the cost
Stay ahead of CSA before it bites.
Trucking compliance, scored. Violations, DVRs, inspections, crashes, HOS and CSA data rolled into clear driver- and vehicle-level scores you can act on — and coach against.
- Scores for pre-DVR, post-DVR, inspections & HOS
- Clean-inspection streaks, crashes & CSA BASICs
- Driver and vehicle views, side by side
Know exactly how hard every vehicle is working.
Vehicle-centric utilization scoring. See which assets are earning their keep, which sit idle, and which are stretched past optimal — across the whole fleet, at a glance.
- Optimal vs under- and over-utilized, per asset
- Working hours and active days by vehicle
- Right-size the fleet with confidence
Build the safety score that fits your fleet.
Choose the events that matter — Lytx video triggers, Geotab exceptions, your own rules — and FleetSense weighs them into one safety score, with the breakdown and footage behind every number.
- Pick the events that count — video, GPS and your own rules
- Weight any behaviour into a single safety score
- Proof it works — coached vs uncoached trend
2.4k Geotab
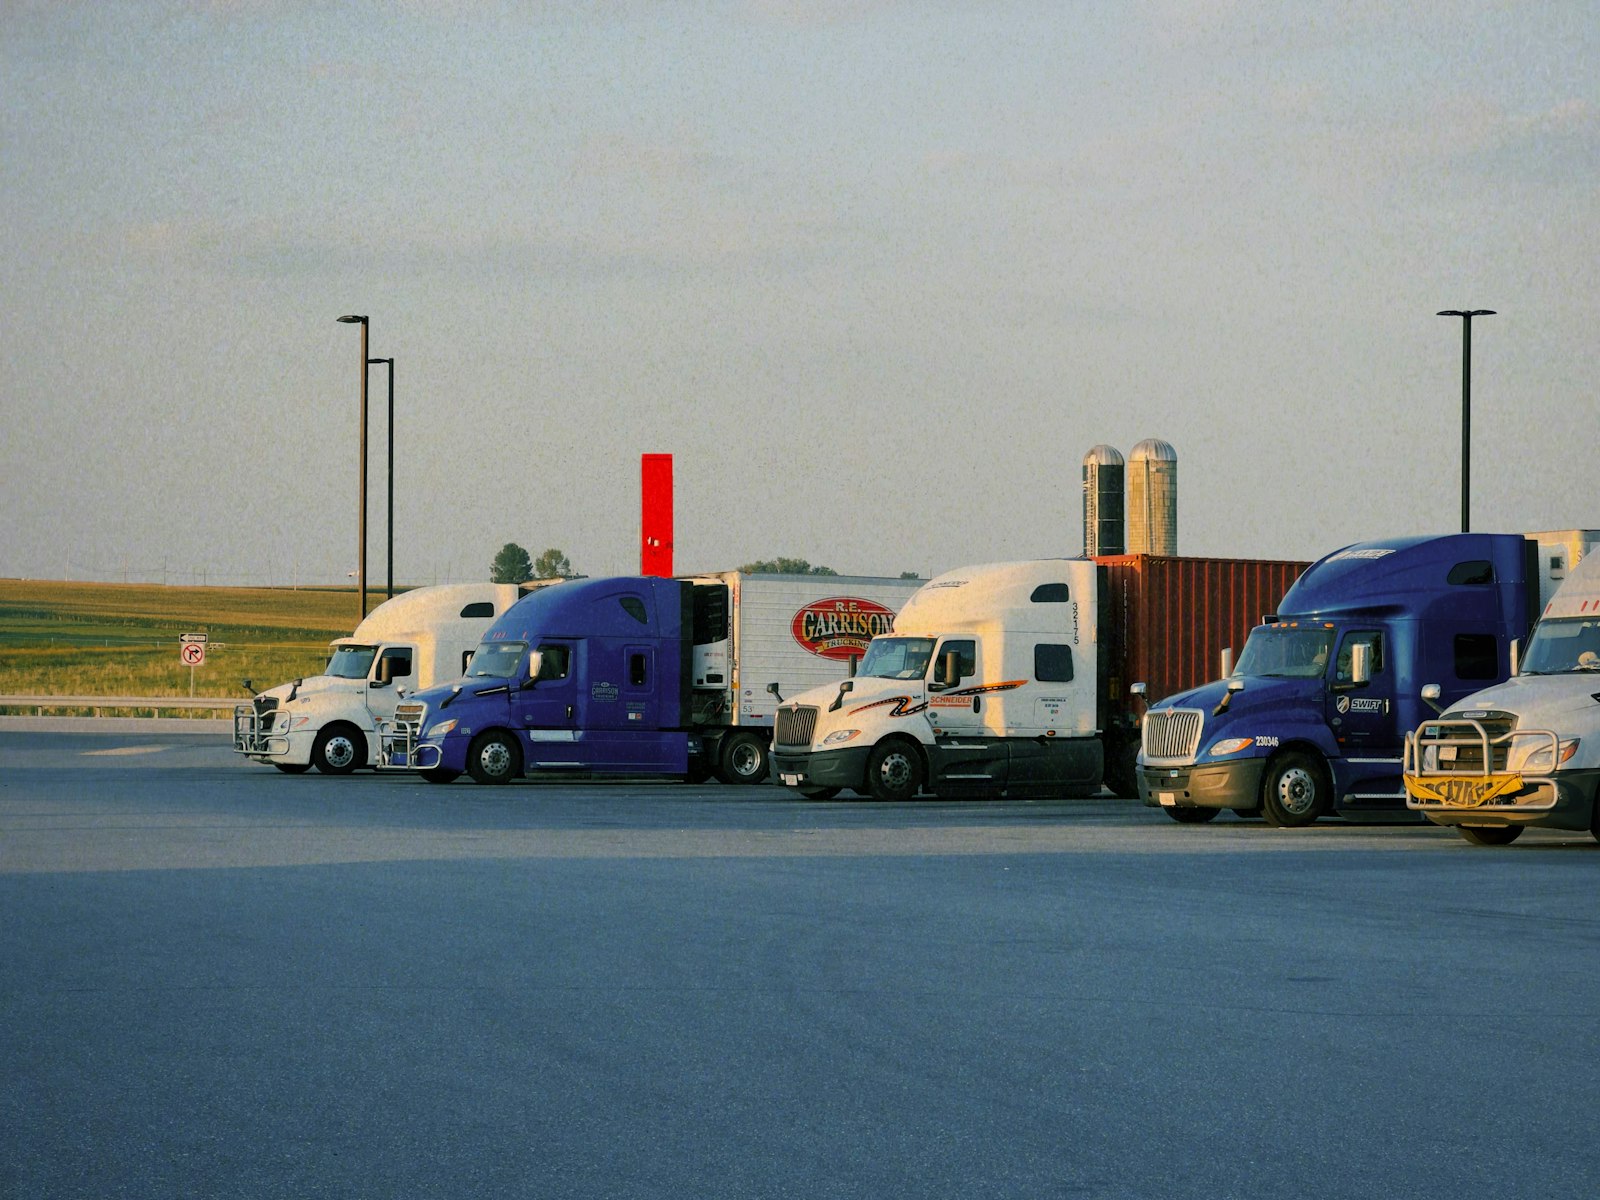
It plugs into the systems you already run.
FleetSense reads from your telematics, video and ELD providers and writes nothing back you don't approve. Setup is a connection, not a migration.
Contact


The best fleets aren't the ones with the most data. They're the ones that act on it — one driver, one vehicle, one coached habit at a time.